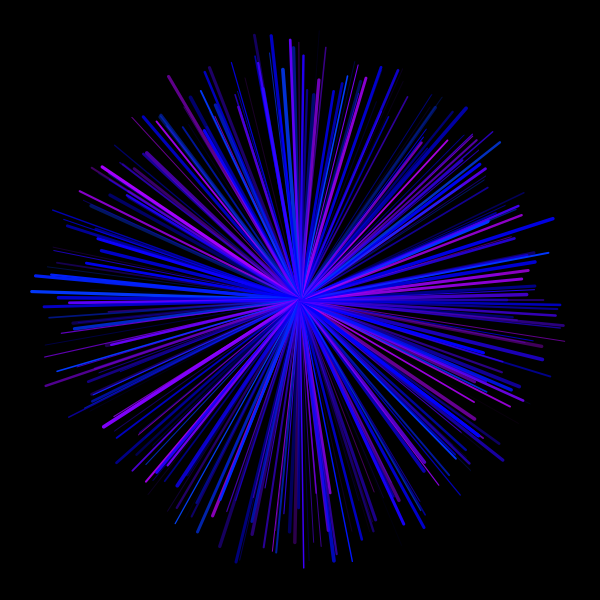
Ever since the graphing package ggplot2 came into existence the base R plotting functions haven’t received much love from users as before, probably due to the prosaic graphs that are on par with Windows 95 UI they create. But they are more than capable of producing beautiful paintings that means exactly nothing like that ball of rays. Don’t believe me? See the code below.
# this defines the general shape of the rays.
theta <- seq(0, 2*pi, length = 300)
x <- cos(theta)
y <- sin(theta)

# set graphical parameters: black background and margins
op <- par(bg = "black", mar = rep(0.5, 4))

# plot
plot(x, y, type = 'n')

# number of rays
n <- 500
segments(rep(0, n), rep(0, n), x[1:n] * runif(n, 0.7),
y[1:n] * runif(n, 0.7),
col = hsv(runif(n, 0.6, 0.8), 1, 1, runif(n, 0.3)),
lwd = 5*runif(n))

# reset par
par(op)
Few points to note:
- The shape of the rays can be changed by varying the first three lines. In this code I’m setting
thetain(0,2*pi)so that it produces a circle. If, say,thetawas now in(0,pi)then we’d get a half-circle. - Too high an
ncan slow the code down but add almost no visual difference to the plot, since the rays will overlay on top of each other. On the contrary, too few rays might make the ball look sparse.
Thanks to Gaston Sanchez for inspiring me to make these weird stuff. There are loads of them on his blog so do pay him a visit if you want to see more.