Article Image
Article Image
read
This is the first project of Udacity’s Data Analyst Nanodegree that I’m currently studying in my free time. The program was well structured and has garnered a lot of positive reviews from past students, so I was excited to jump on this bandwagon.
In this particular project, I experimented with two of the major parts of the data analysis process: data wrangling and exploratory data analysis. In 2014, Bay Area Bike Share held an Open Data Challenge to encourage data analysts to create visualizations based on their open data set. For this project, I used the same data to answer some questions such as:
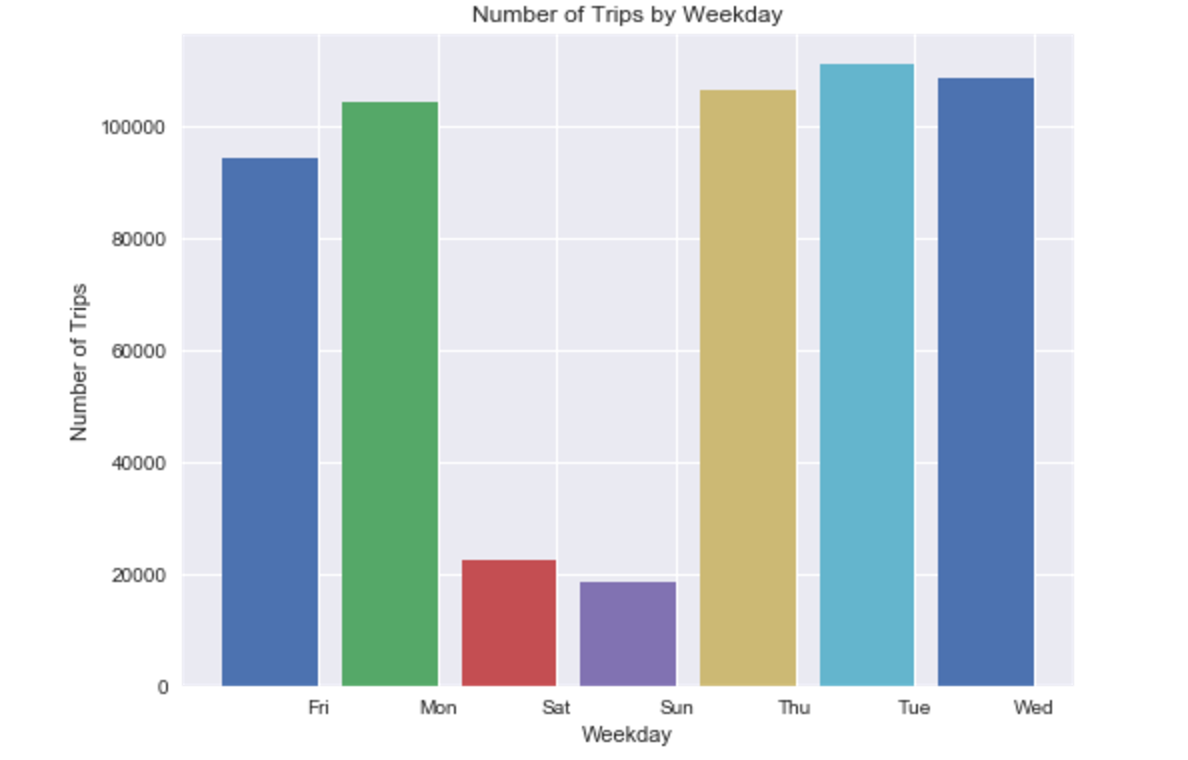
- When is Bay Area Bike Share used most often?
- What is the most popular route?
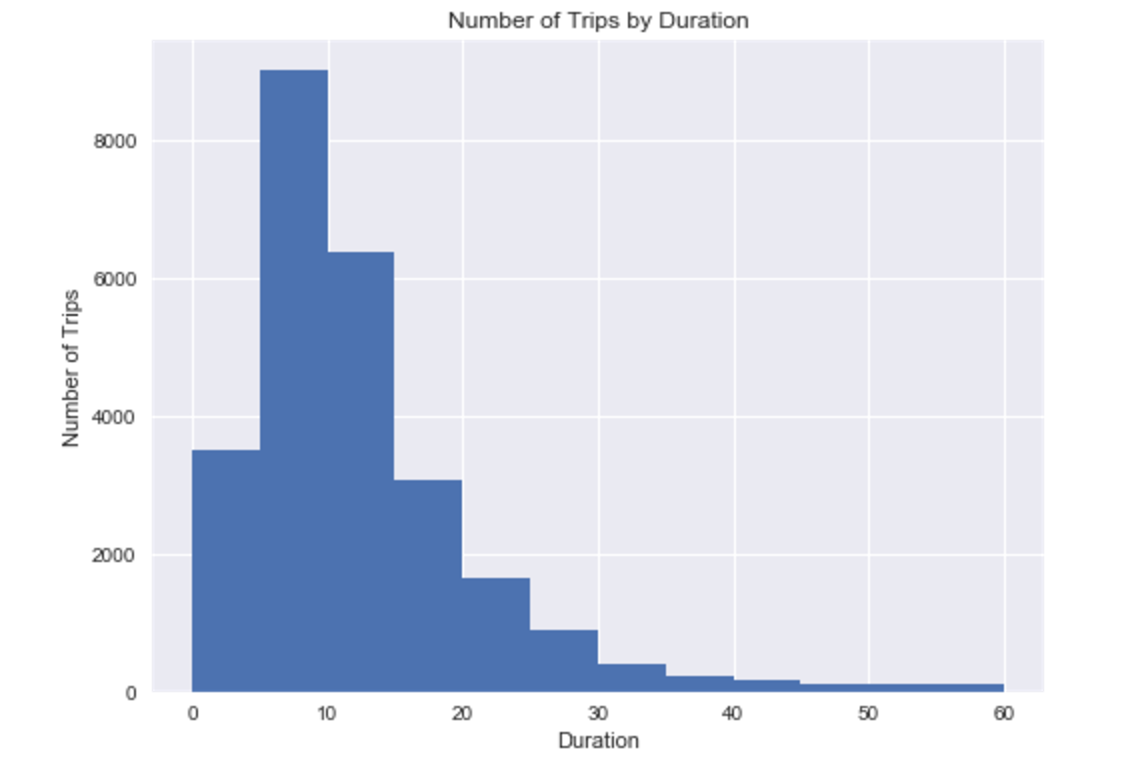
- How long, on average, does a trip take?
Project website
The project was done in a Jupyter Notebook, which can be found here
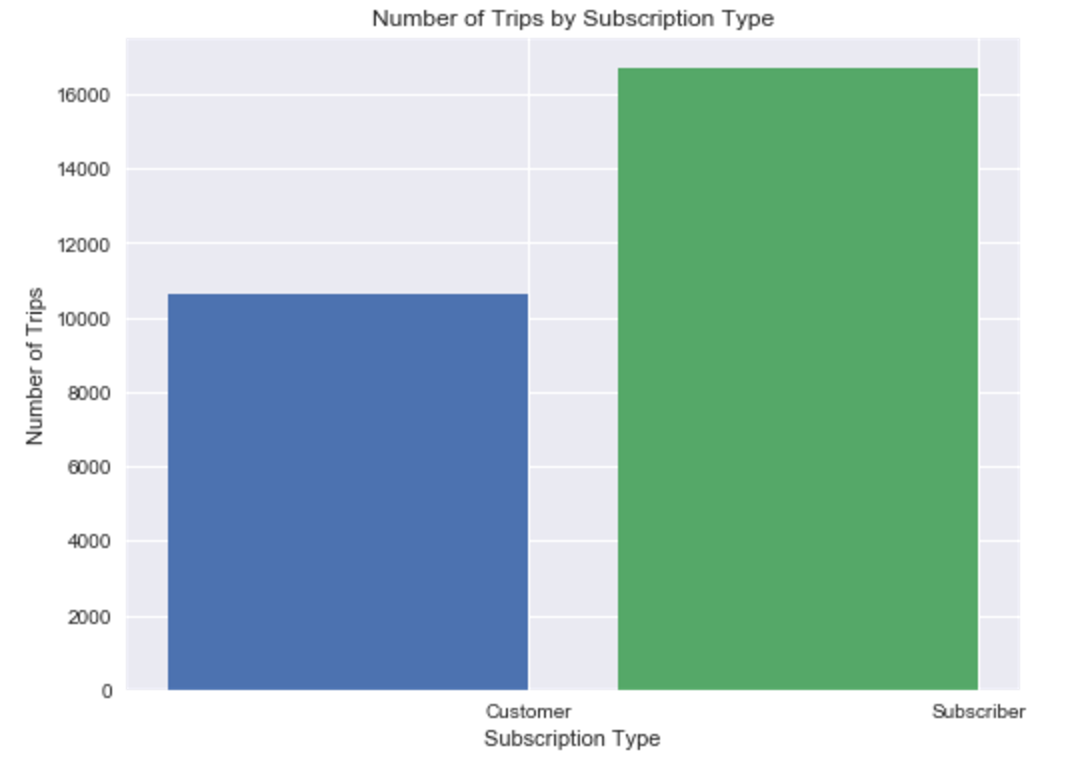
Sample screenshots