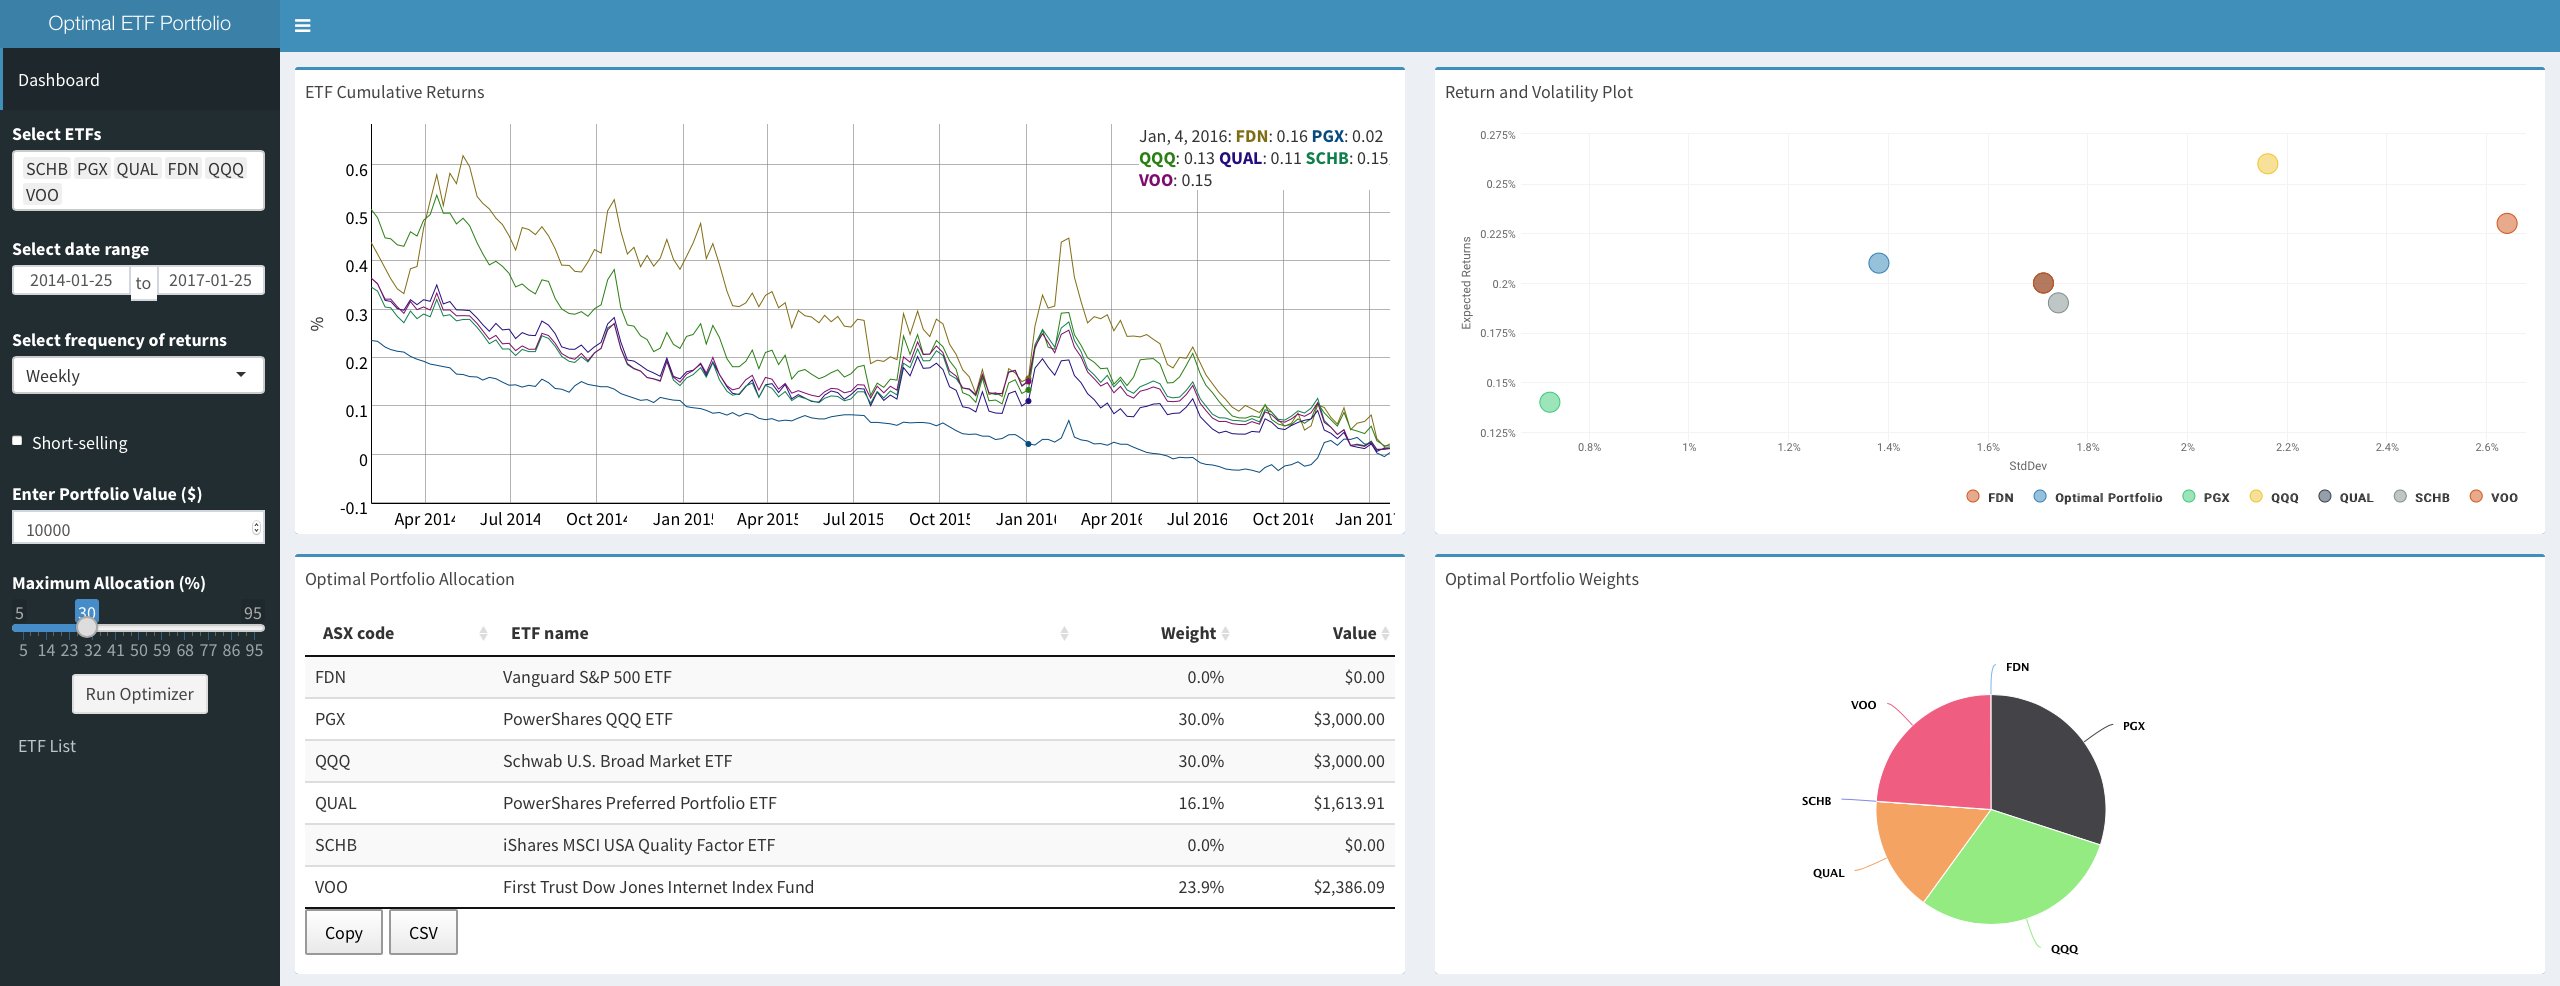
It’s the start of my CNY holiday and I finally get some off time to dig into some R codes, this time with Shiny dashboard. Inspired by this, I have made a similar app with U.S. ETFs, since data for these are more complete and readily available at Yahoo!Finance. I also decided to replace some static chart with highcharter interactive chart, and implemented my own mean-variance optimized portfolio with options to specify maximum allocation per security and ability to short-sell.
Project website
The app is written and deployed in R. You can find the source code on my GitHub here
Update 18/05/2017: It has come to my attention that Yahoo Finance has changed their API and thus most download functions, including the one I’m using for this dashboard, will no longer work. If anyone is interested in developing a fix, please follow this GitHub thread.